本作品選自陳翊齊老師的「科技英文寫作與表達」,展示學生如何運用技術英文寫作能力,有條理地呈現一項以潛在賽局為基礎的衛星切換策略研究。文章從動機、方法到模擬結果皆以清晰的邏輯鋪陳,並透過圖表輔助讀者理解演算法運作與參數影響。此文不僅展現紮實的工程分析,也示範如何以易讀方式傳達複雜技術內容。
在全球連網需求快速增加的背景下,低軌衛星系統扮演越來越重要的角色。本作品從此議題出發,介紹一種基於潛在賽局的衛星切換策略,並透過 MATLAB 實作與模擬進行分析。文章以明確的架構與視覺化資料,帶領讀者理解演算法設計、參數設定與系統效能之間的關聯,是將工程內容轉化為可讀敘事的良好範例。
Final Project
Implementation and Performance Analysis of a Handover Strategy
Group 1
Yao-Yu Lee (B10901007)
Yu-Hua Chen (B10901100)
Chun-Che Lin (B10901192)
Abstract
This project encompasses the implementation, performance analysis, and application extension of an algorithm for computing a handover strategy based on a potential game [1]. The algorithm, originally built using Systems Tool Kit (STK), has now been implemented in MATLAB. Additionally, this project replaces the original satellite constellation, Iridium, with OneWeb, which offers a greater selection of satellites. Ultimately, this project analyzes the effects of the parameters used in the algorithm and discusses the differences between the implementation and the original paper.
1 Introduction
The International Telecommunication Union (ITU) have found that in 2018, about 3.8 billion people were still unconnected and thus cannot benefit from the flourishing information online [2]. To eliminate these blind areas, one may resort to deploying much more terrestrial base stations (BSs). Nonetheless, problems related to electricity, construction, environment, and politics would arise. As a consequence, deploying space-based satellite constellations (SatCons) appears to be a more suitable solution [3].
Mobility is one of the main differences between satellite communication and terrestrial communication. While BSs are static, SatCons move at a high speed of 7 km/sec, leading to the necessity of adapting the handover strategies. Hence, we implement the satellite handover strategy based on a potential game proposed in [1] and compare the results between our works and [1].
Previous method for the handover problem can be classified into three categories [4]. (1) Reinforcement Learning (2) Potential Game (3) Optimization criteria. In [5], a MARL-based approach is proposed. It proves the ability of ML-type solver to reduce handover occurrence. Meanwhile, a method proposed in [6] utilizes a multi-objective function based on entropy, enhancing the optimization of handover counts while considering factors of global interest.
2 Theoretical Framework
2.1 Potential Game
A potential game is a type of game in game theory where changes in an individual player’s strategy leads to changes in their payoff that are directly reflected by a potential function. This method serves as a global measure of the whole system, ensuring that individual and collective interest are both considered, which well suits the handover problem in the following ways.
- Mathematical Modeling: game theory provides a structured approach to model the interactions between the satellites and mobile devices.
- Optimal Strategy Formulation: Each user terminal seeks for the best strategy to maximize its utility.
- Equilibrium Analysis: Identifying Nash equilibrium helps in understanding states where no terminal can improve its situation, making utilization more efficient.
By modeling the interactions using game theory, it is able to compute optimal solutions considering various factors efficiently.
In the satellite-terminal connections, the links can be modeled as different terminals competing for resources, which in this case are the satellite channels. Therefore, the handover problem can be trans- formed into a game, and the utility function designed in the paper can further convert this game into a potential game.
2.2 Bipartite Graph
A bipartite graph is a kind of graph where the sets can be divided into two disjoint subsets, such that no edges no vertices in the same subset are adjacent. The graph well suits the demonstration of a network. In a LEO satellite system, the dynamic characteristics are presented by dividing the satellite network topology into several time slots. The network topology remains unchanged in each time slots. The relation between satellite and network can be realized by a simple bipartite graph G = < X , E , Y > , where X and Y represent satellite and terminal, and E represents the connection between satellite and terminal.
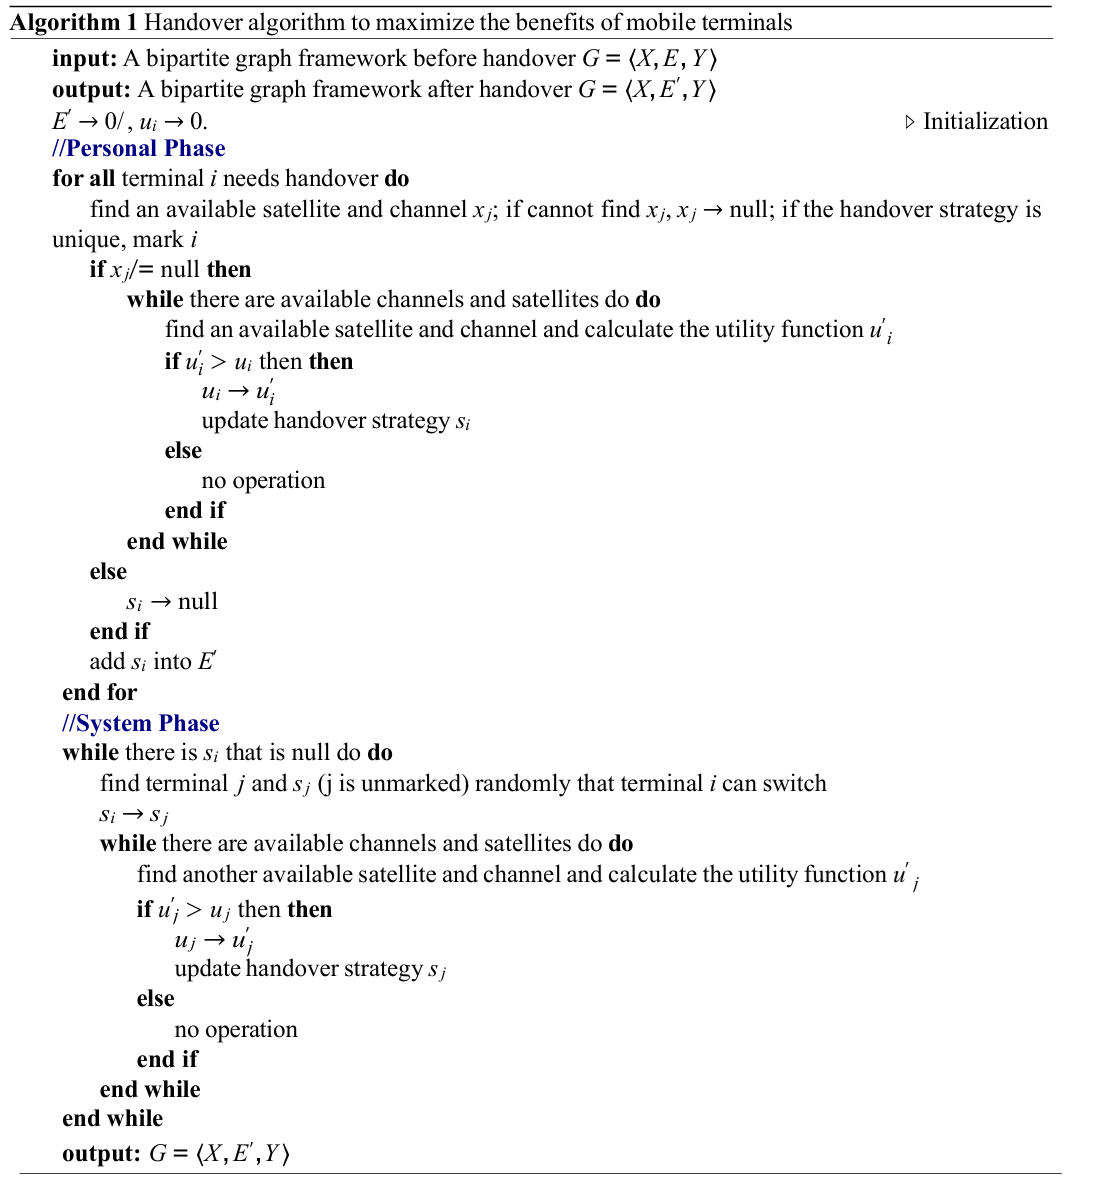
3 Algorithm
We now present the algorithm. The algorithm is introduced in the following three section:
- The utility function: the utility function helps taking various factors into account, thereby proving Nash equilibrium.
- The Handover algorithm: The algorithm helps maximizing the benefits of mobile terminals.
- The Random access algorithm: The random access algorithm helps balancing the constellation load, and maximizing user space.
3.1 The Utility Function
The utility function is designed to reflect the conditions of several considered factors, including call quality, number of handovers, balance of the work load.
ui(S) = gi(S) - li(S) (1)
gi(S) = αt*ij + βθ*ij (2)
li(S) = wreqt*req, ij + wrest*res, ij (3)
As above, the utility function is composed of a gain and a loss function. Focusing on the gain function, α and β are coefficient that sums to 1. t*ij denotes the normalized remaining time, which reflects the number of handovers. θ*ij denotes the normalized elevation angle, which reflects the call quality. On the other hand, the loss function is composed of request time and response time multiplied by a weight. It usually has less effect on the utility function.
3.2 The Handover Algorithm
The handover algorithm maximizes the benefit of terminals. It consists of two different phases. In the personal phase, each terminal calculates its utility function to select the optimal strategy. However, if no channel is available, the algorithm enters system phase. A random terminal vertex nearby available is selected. Therefore, the update strategy is based on the utility function.
3.3 The Random-access Algorithm
When a new mobile terminal aims to access the network , the random-access algorithm helps balancing network load. Depending on the density nearby, the algorithm gives different strategies. For a location sparsely populated (ocean), simply update the strategy based on utility function. Meanwhile, for a location densely populated (land) , choose a satellite that has more available channels.
4 Experiment Setup
4.1 Satellite Constellation
In the implementation, OneWeb Satellites are used instead of Iridium Satellites since it has been found that Iridium cannot provide complete coverage of the Earth at all times, given that the elevation angle must be larger than the threshold of 10°. There are currently 648 satellites in service in the OneWeb Satellites constellation, providing satellite Internet services worldwide. The data for these satellites are collected from Celestrak [7], which contain 631 of 648 satellites.
4.2 Terminals
In the experiment described in the original paper, there are only 30 terminals randomly distributed across the world. In reality, however, population distribution is uneven, with most people living in large cities, especially in China and India. To more accurately simulate the actual population distribution, this project selects 195 cities with more than 2 million inhabitants [8] and places one terminal for every 2 million people in each city. There are 426 terminals in total. The distribution of these cities is shown in Fig. 1.
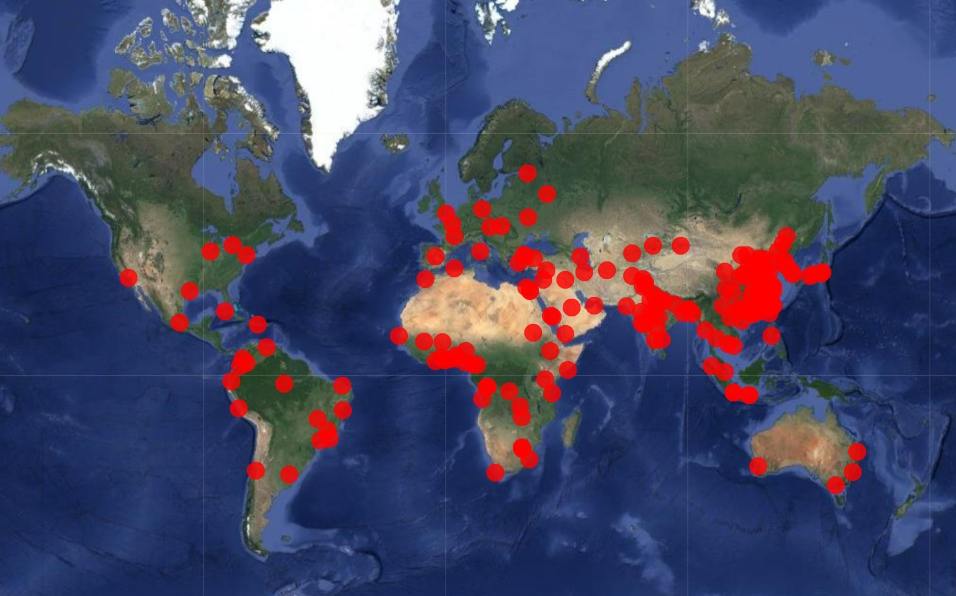
Figure 1: Distribution of cities selected as terminals
(Background: Google Earth)
4.3 Experiment Platform
The experiment is conducted primarily using MATLAB, with Python serving as a tool for data preprocessing. MATLAB offers a variety of toolboxes that assist in visually simulating the satellite network and computing elevation angle data, which are crucial components of this algorithm. In this experiment, the Aerospace Toolbox and Satellite Communication Toolbox are utilized for simulating and computing the aforementioned data, while the Statistics and Machine Learning Toolbox generates random times for each simulated call from terminals. On the other hand, Geocoding API and Python are employed to determine the latitude and longitude of the selected terminals. This information is later used in the main code in MATLAB.
4.4 Simulation Setup
For OneWeb satellites, the inclination is 87.9° and the altitude is 1200 km (the same as [9]), while the elevation angle threshold is set as 10° (the same as the [1]). For algorithm computation, the sample time for terminals and satellites is 5 seconds, and the total simulation time is 3 hours. Each call from a terminal is characterized by both start time and duration, which follow identically independently distributed (i.i.d.) exponential distributions:
f(x) = λe-λx
where f is the probability density function (PDF), and λ is the inverse of mean µ of the random variable. In the experiment, µ is set to 1000 seconds for both the start time and duration, and it will be changed while discussing the effect of average call duration (ACD).
5 Simulation Results and Discussion
5.1 Call Quality
The simulated call quality versus α is depicted in Fig. 2(a). Note that the call quality is represented by the elevation angle since the call quality is determined by the SNR and [1] calculates SNR solely based on the elevation angle. 2(b) presents the counterpart found in [1].
The results of [1], shown in Fig. 2(b), indicate that the best call quality is achieved when α has a smaller value; specifically, increasing the weight of the elevation angle and decreasing the weight of the remaining visible time will leads to an improvement in the call quality. However, our simulation results, shown in Fig. 2(a), indicate that the best call quality occurs when α is at 0.6, which suggest that there is still a trade-off relationship between the remaining visible time of the satellite and the elevation angle.
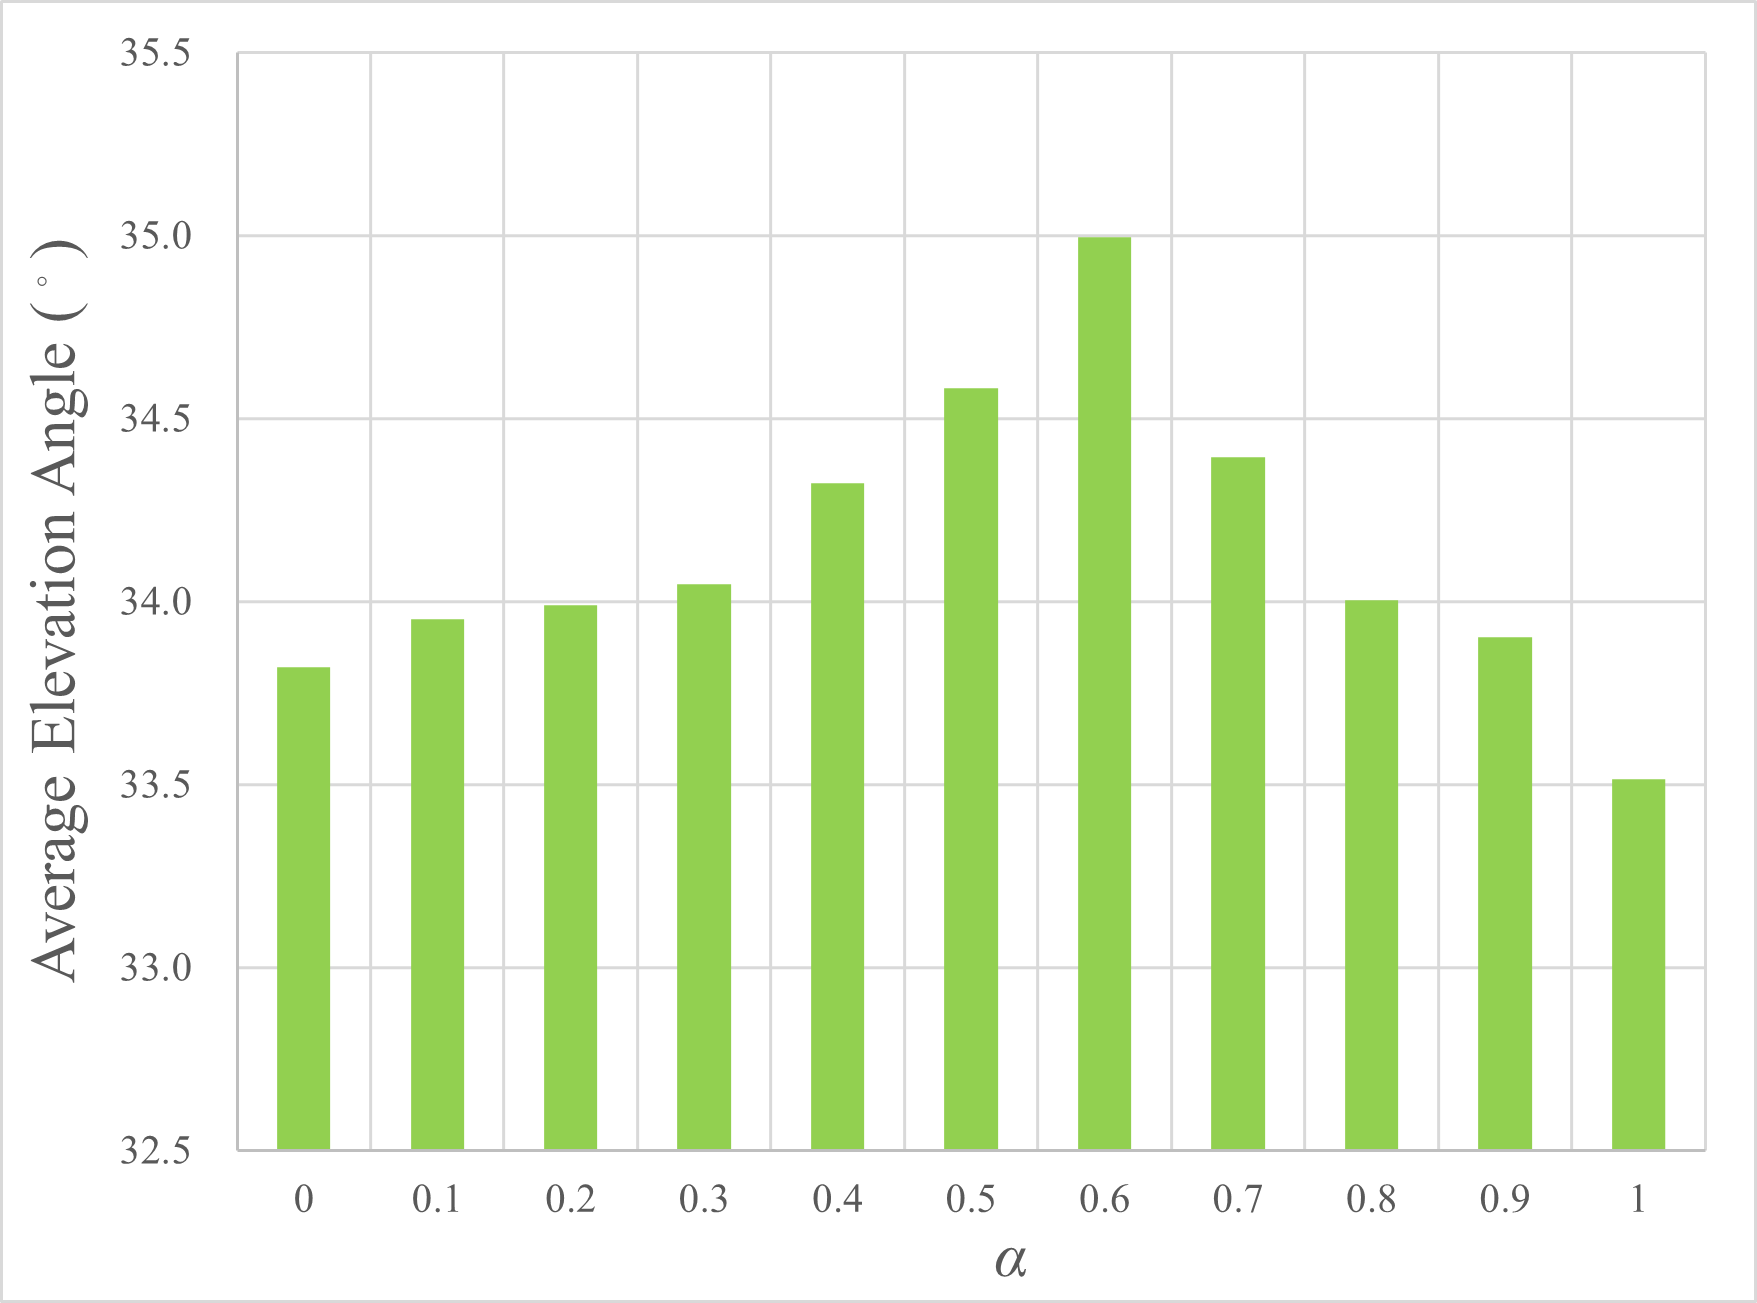
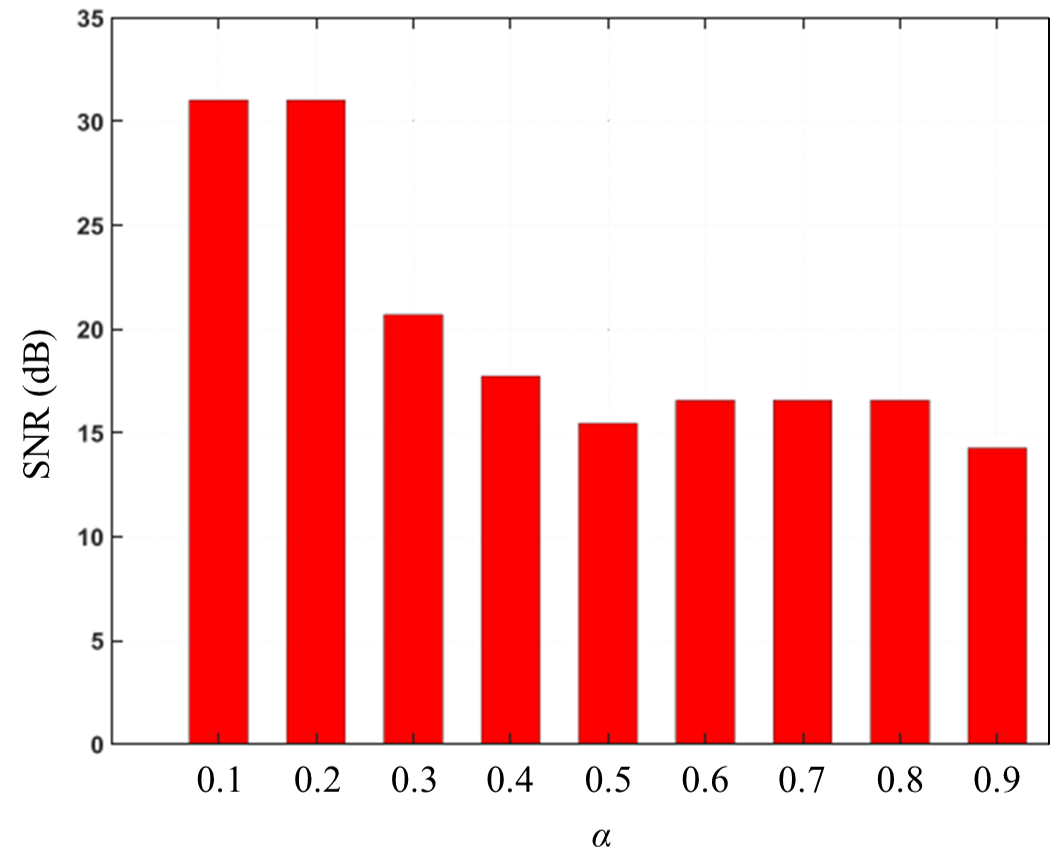
(a) Our Works (b) Results of [1]
Figure 2: The call quality versus α
5.2 Average Handover Number
Next, we conducted simulations related to the average number of handovers to explore the relationship between ACD and average handover number under different α values.
Fig. 3(a) illustrates the relationship between simulated average handover number E ( N ) and average call duration (ACD), while Fig. 3(b) is the corresponding results found in [1]. Note that in our works, the ACD is adjusted to different values ranging from 500 to 1500 seconds since we have found that when ACD is too short, the average handover number is very low, necessitating a longer simulation time.
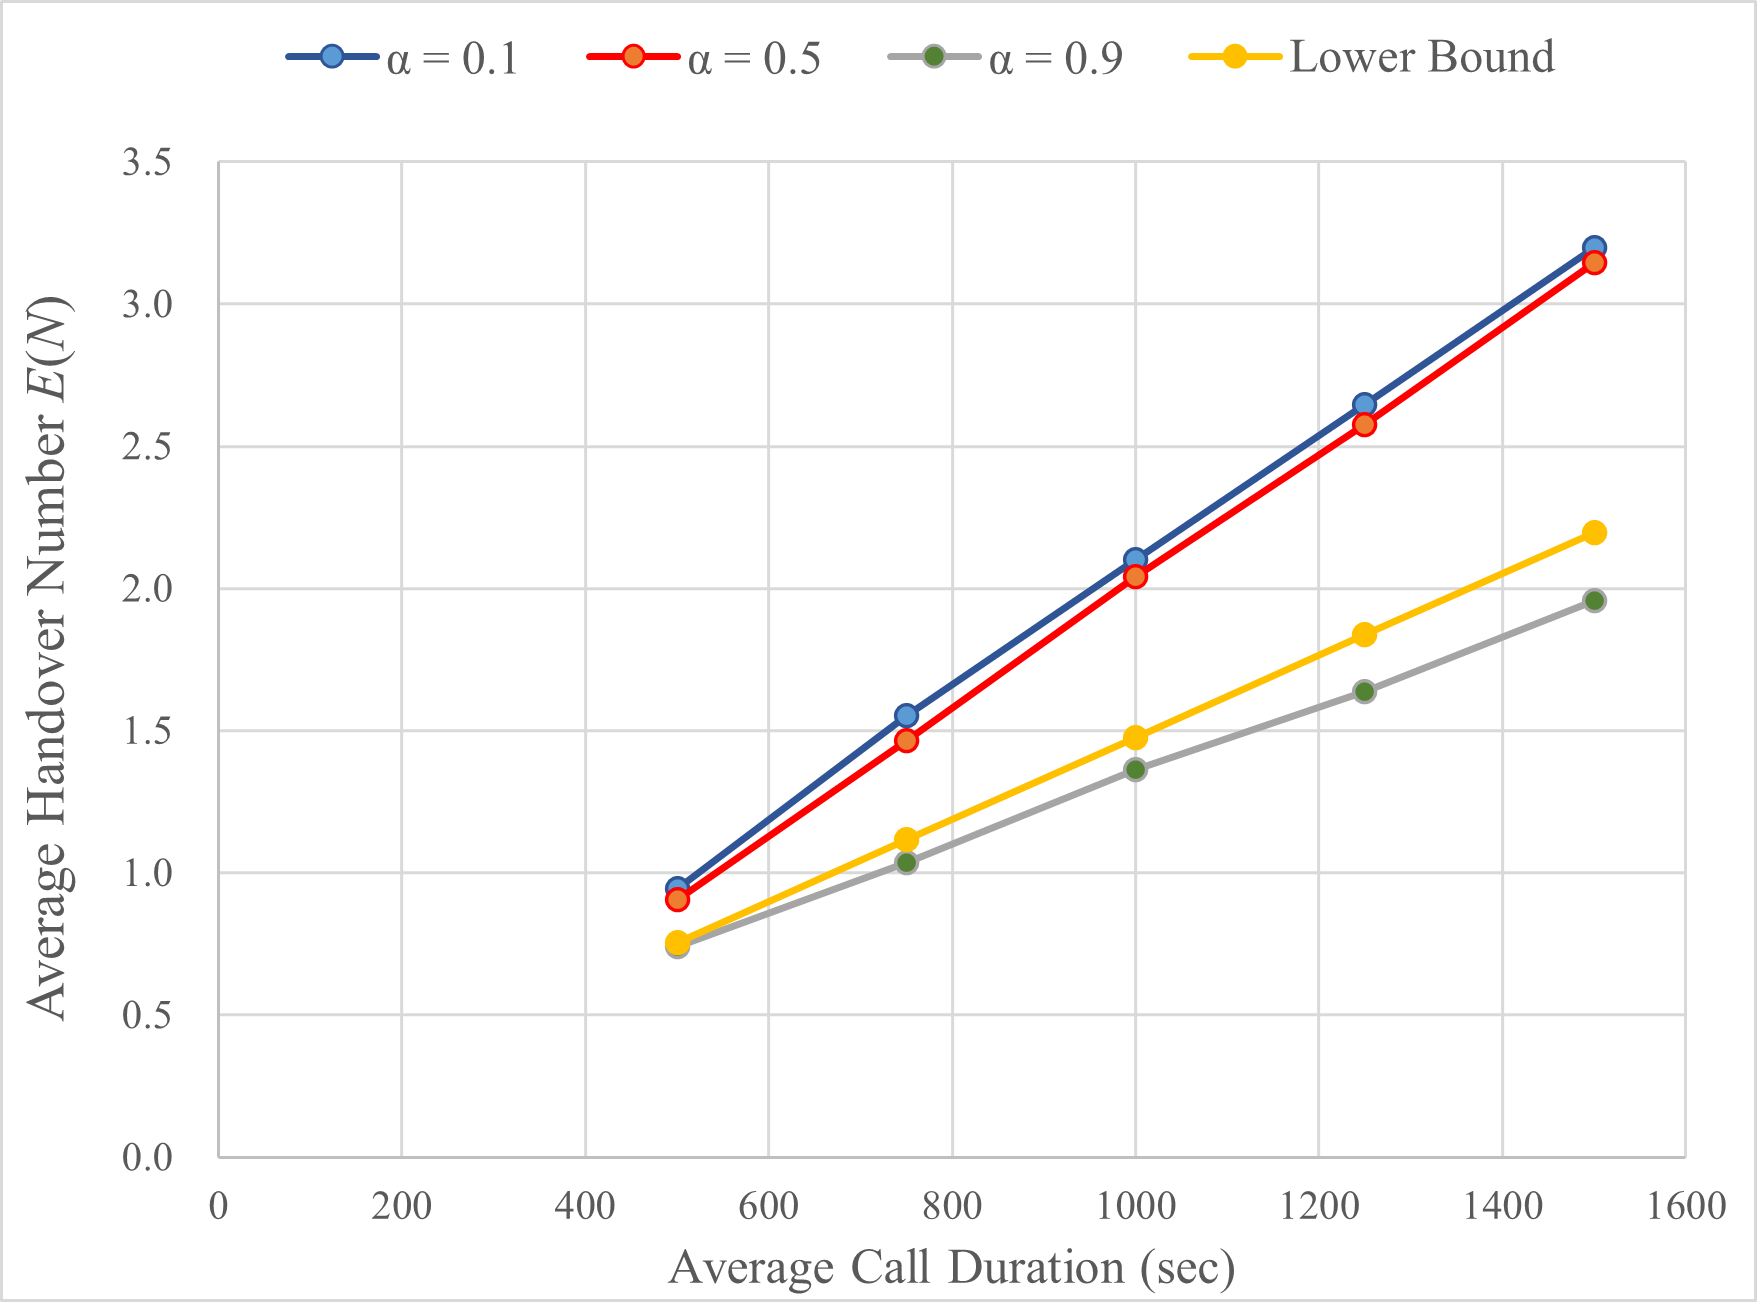
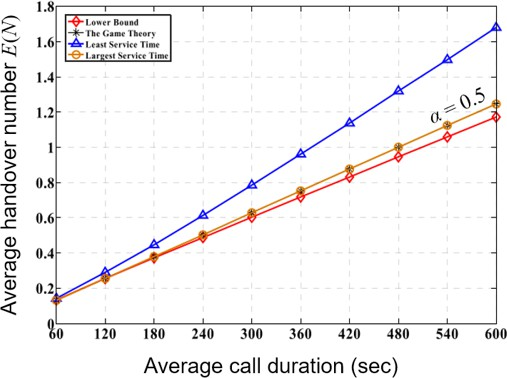
(a) Our Works (b) Results of [1]
Figure 3: The average handover number E(N) versus average call duration
From both our simulations and those in the paper, we observed that the relationship between the average number of handovers and ACD is positively correlated and linear. Thus, as the call duration increases, the need for handover increases as well. Moreover, our results show that the larger the alpha is, the closer this straight line approaches the lower bound. Note that when α = 0.9, the line falls below the lower bound derived in [10], which could be due to conducting the simulation only once, instead of simulating multiple times and then taking the average. This could have led to the line falling below the lower bound by chance.
Lastly, we examined the relationship between the average number of handovers and α. Fig. 4(a) illustrates the relationship between simulated average handover number E ( N ) and α, while Fig. 4(b) is the corresponding results found in [1]. Similarly, the ACD is adjusted to larger values of 540 and 1500 seconds to reduce the simulation time.
As shown in Fig. 4(b), the resulting graph consist of horizontal lines, and thus [1] claims that variations in α have little impact on the average handover number. On the contrary, our results shown in 4(a) indicate a different trend. Specifically, we observed that when α exceeds 0.6, the average handover number tends to decrease. Consequently, we propose that there is a correlation between α, the weight of the remaining available time of the satellite, and the average handover number, rather than these factors being independent of each other.
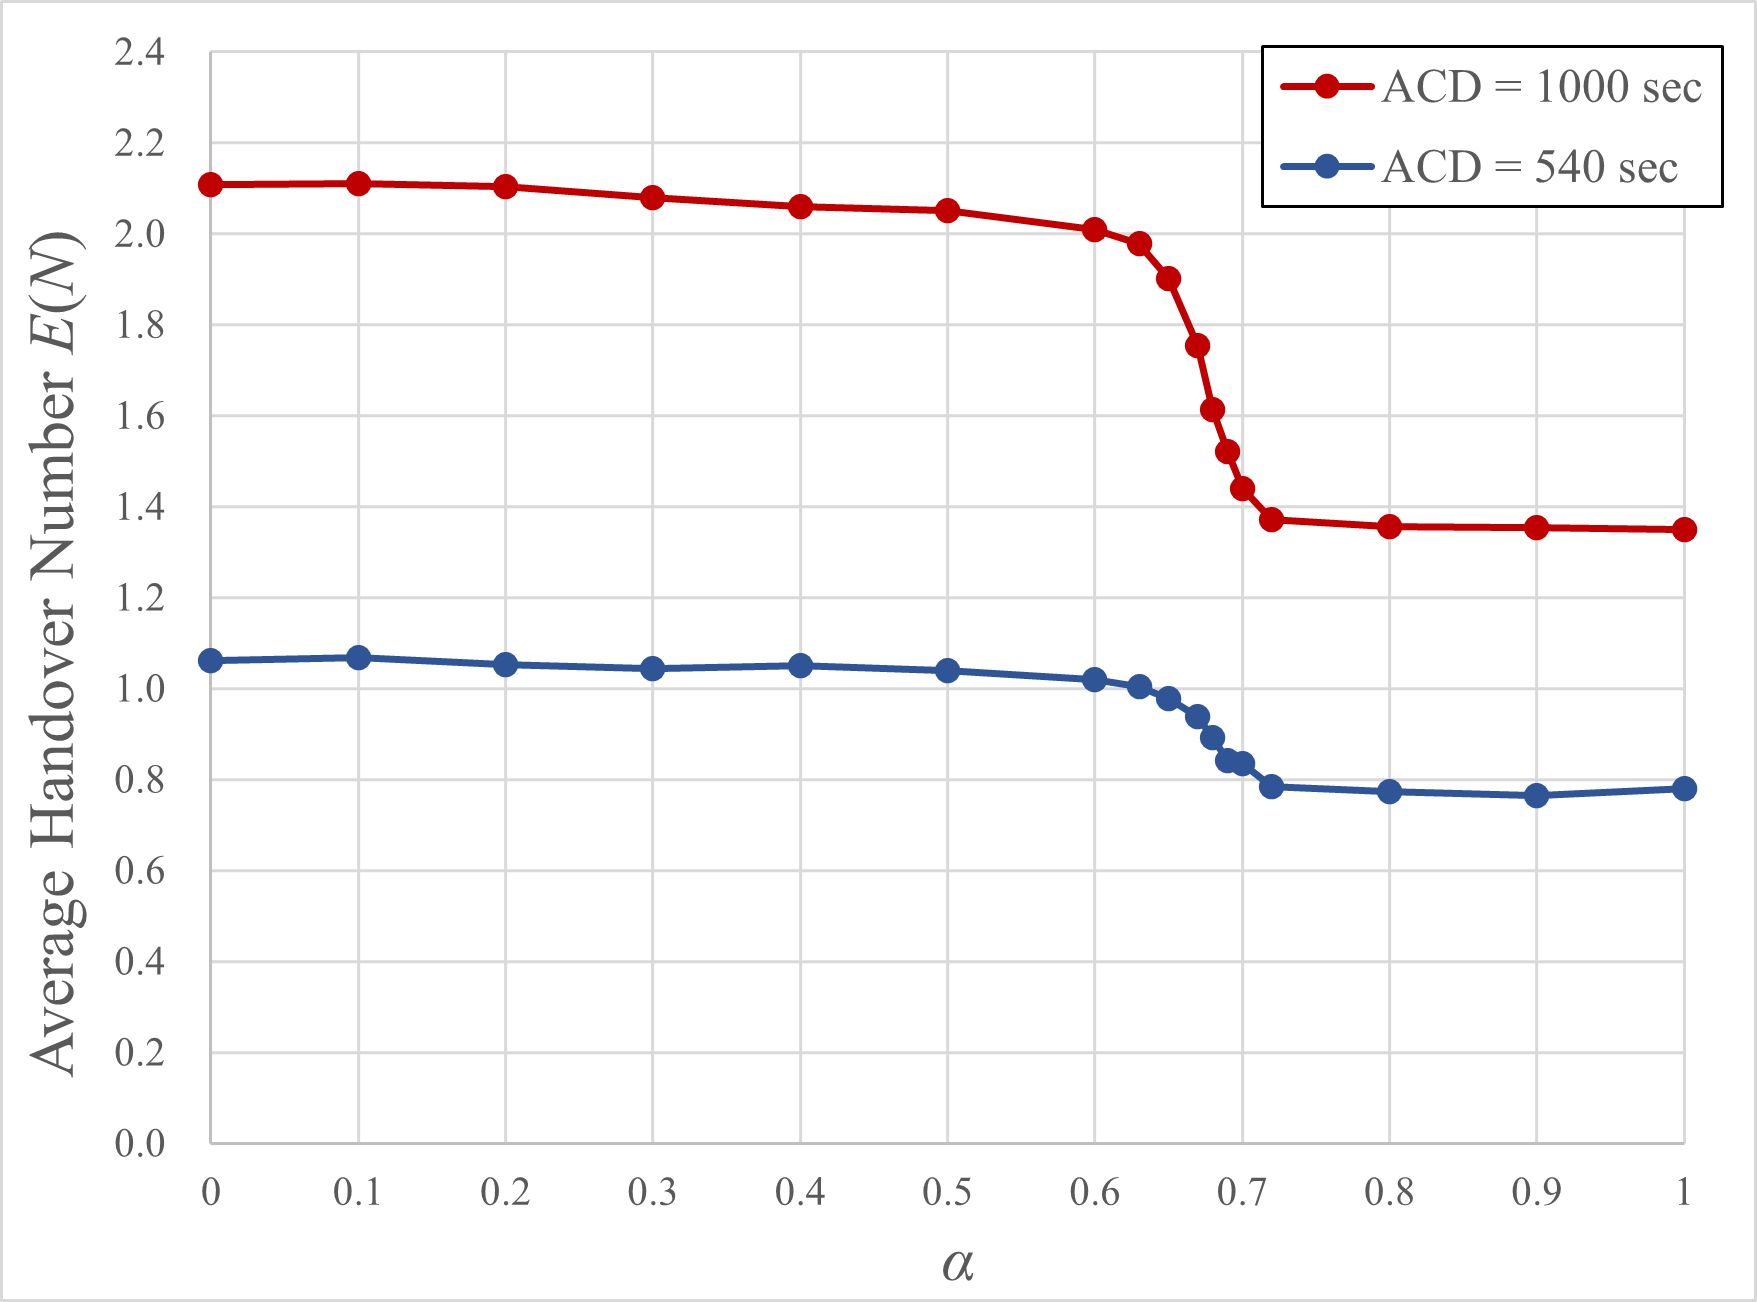
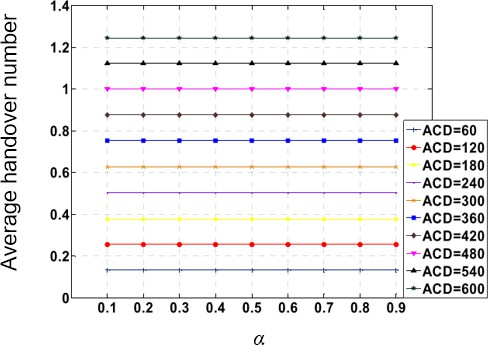
(a) Our Works (b) Results of [1]
Figure 4: The average handover number E(N) versus α
Conclusion
Simulation results of both our works and [1] show that this algorithm based on potential game can reduce the number of handovers and improve call quality for some values of α. While both we and [1] find similar relationship between average handover number and the average call duration (positively correlated and linear), α tend to have different impact on both call quality and average handover number. This difference may result from the following reasons:
- The sampling time is much larger: While [1] does not specify the sampling time, the sampling time Tsample is 5 seconds, which is a large time.
- User terminals are unevenly distributed: While [1] appears to distribute the user terminals ran- domly across the Earth, we set more user terminals in highly-populated areas and fewer in less- populated areas.
- Different satellite constellations are used: Iridium, utilized by [1], comprises 66 satellites, while OneWeb, employed in this project, consists of 631 satellites, thereby achieving higher coverage.
References
[1] Y. Wu, G. Hu, F. Jin and J. Zu, “A Satellite Handover Strategy Based on the Potential Game in LEO Satellite Networks” in IEEE Access, vol. 7, pp. 133641-133652, 2019.
[2] ITU, “Measuring the Information Society Report 2018,” vol. 2, Dec. 2018, pp. 3-4.
[3] S. Liu et al., “LEO Satellite Constellations for 5G and Beyond: How Will They Reshape Vertical Domains?,” in IEEE Communications Magazine, vol. 59, no. 7, pp. 30-36, July 2021.
[4] Park, Soohyun, and Joongheon Kim. “Trends in LEO satellite handover algorithms.” 2021 Twelfth International Conference on Ubiquitous and Future Networks (ICUFN). IEEE, 2021.
[5] Chen, Jinxuan, Mustafa Ozger, and Cicek Cavdar. “Nash Soft Actor-Critic LEO Satellite Handover Management Algorithm for Flying Vehicles.” arXiv preprint arXiv: 2402.00091 (2024).
[6] Zhang, Shaofeng, et al. “Multi-objective satellite selection strategy based on entropy” 2021 13th International Conference on Wireless Communications and Signal Processing (WCSP). IEEE, 2021.
[7] D. T. Kelso, Celestrak, 1985, [Online] Available: https://celestrak.org/.
[8] Wikipedia contributors, “List of cities with over one million inhabitants—Wikipedia, The Free Encyclopedia,” 2024. [Online]. Available: https://en.wikipedia.org/wiki/List_of_cities_with_over_one_million_inhabitants.
[9] V. L. Foreman, A. Siddiqi, and O. De Weck, “Large satellite constellation orbital debris impacts: Case studies of oneweb and spacex proposals,” in AIAA SPACE and Astronautics Forum and Ex- position, 2017, p. 5200.
[10] Y. Seyedi and S. M. Safavi, “On the Analysis of Random Coverage Time in Mobile LEO Satellite Communications,” in IEEE Communications Letters, vol. 16, no. 5, pp. 612-615, May 2012.